Code to download the data
Code
library(tidyverse)
library(tigris)
library(sf)
library(ggtext)
library(showtext)
showtext_opts(dpi = 300)
showtext_auto(enable = TRUE)

# Fonts
font_add_google("Sora")
f1 = "Sora"
font_add_google("Open Sans")
f2 = "Open Sans"

# Data
water_area = area_water("washington", "okanogan county", year = 2022)
water_linear = linear_water("washington", "okanogan county", year = 2022)
Set the bounding box.
Code
library(osmdata)
library(sf)
library(tidyverse)

# Center and circle ----
city_coords <- tibble(address = "Winthrop, Washington") |>
  tidygeocoder::geocode(address, method = 'osm', long = long, lat = lat)

long <- city_coords$long[1]
lat <- city_coords$lat[1]

crs2 <- 6384 # https://epsg.io/6384
center_proj <-
  tibble(long, lat) %>%
  st_as_sf(coords = c("long", "lat"), crs = 4326)

# 10km circle to crop in ----
dist <-  10000
circle <- tibble(long, lat) %>%
  st_as_sf(coords = c("long", "lat"), crs = 4326) %>%
  st_transform(crs = crs2) %>%
  st_buffer(dist = dist) %>%
  st_transform(crs = 4326)

water_area_crop <- water_area %>%
  st_transform(crs = 4326) %>%
  st_intersection(circle)
water_linear_crop <- water_linear %>%
  st_transform(crs = 4326) %>%
  st_intersection(circle)
Plot code
Code
ggplot() +
geom_sf(data = circle, color = "black", fill = "white") +
geom_sf(data=water_area_crop, fill="#173C6D",color="#173C6D", size=.4) +
geom_sf(data=water_linear_crop, color="#0096c7", size=.3) +
coord_sf() +
theme_void() +
theme(
plot.subtitle = element_markdown(size=13, lineheight = 1, face="bold", hjust=.5, margin=margin(t=-10)),
plot.title = element_markdown(family=f2, size=7.5, lineheight=1.4,margin=margin(l=-70, t=300, b=-350)),
plot.caption=element_text(family=f2,color="#33415c",hjust = .5, size=7, margin=margin(t=-5)),
plot.margin=margin(t=0,l=3,r=.2,b=.3,unit="cm"),
plot.background = element_rect(fill = "grey98", color = NA)
) +
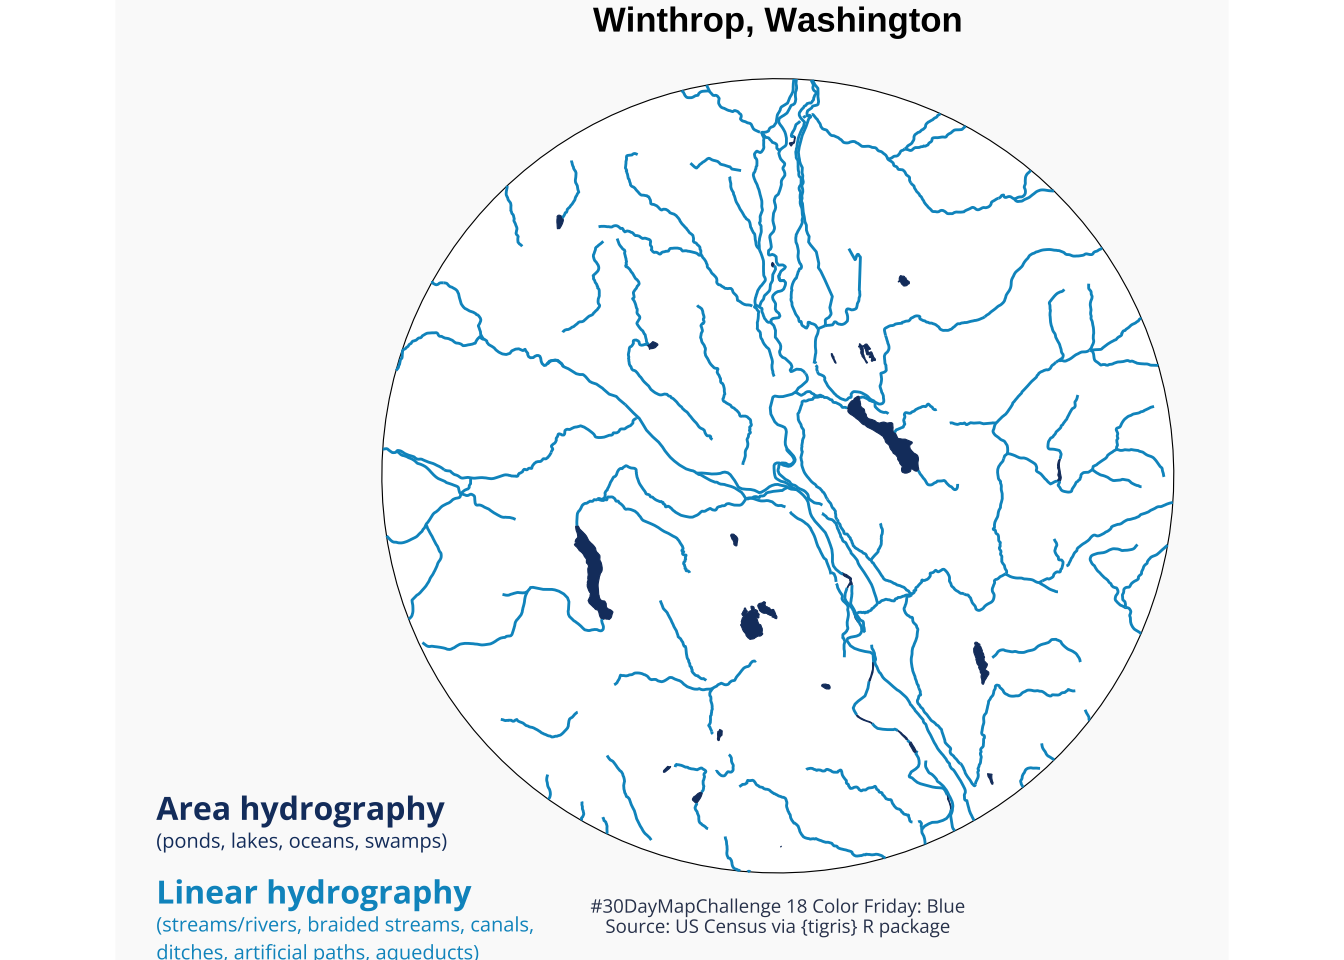
labs(subtitle="Winthrop, Washington",
title="<span style='font-size:12pt;color:#173C6D'><b>Area hydrography</b></span><br><span style='color:#173C6D;'>(ponds, lakes, oceans, swamps)</span><br><br><span style='font-size:12pt;color:#0096c7'><b>Linear hydrography</b></span><br><span style='color:#0096c7'>(streams/rivers, braided streams, canals,<br>ditches, artificial paths, aqueducts)</span>",
caption="#30DayMapChallenge 18 Color Friday: Blue\nSource: US Census via {tigris} R package")