ggplot() +
geom_spatraster(data = hill, fill=vector_cols, maxcell = Inf) +
geom_spatraster(data=r, maxcell = Inf) +
scale_fill_hypso_tint_c(limits = as.vector(minmax(r)),
palette = "dem_poster",
alpha =0.8,
labels = scales::label_comma(),
breaks = c(seq(0,1000, 250), seq(2000, 6000, 1000))) +
guides(fill=guide_legend(title = "elevation", reverse = TRUE)) +
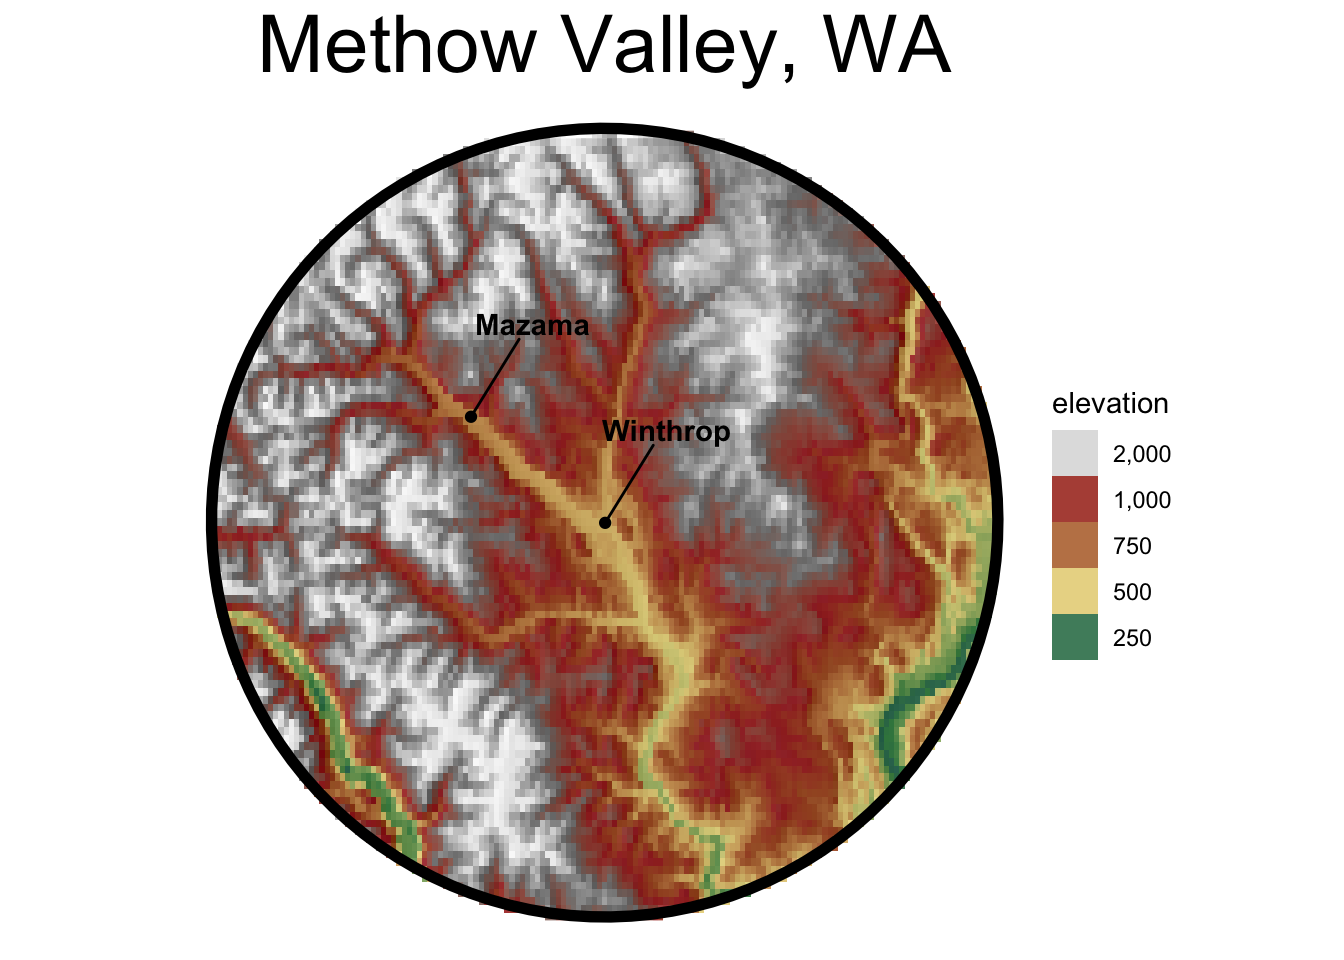
labs(title = "Methow Valley, WA") +
geom_sf(data = circle, color = "black", fill = NA, linewidth = 2) +
geom_sf(data=winthrop_center) +
geom_text_repel(data = winthrop_center, aes(x=long, y=lat), label="Winthrop",
fontface = "bold", nudge_x = .1, nudge_y = 0.1) +
geom_sf(data=mazama_center) +
geom_text_repel(data = mazama_center, aes(x=st_coordinates(mazama_center)[1], y=st_coordinates(mazama_center)[2]), label="Mazama",
fontface = "bold", nudge_x = .1, nudge_y = 0.1) +
theme_void() +
theme(plot.title = element_text(hjust = 0.5, size = 30))