Baccalaureate Origins of Sloan Fellows, part 1
Published:
Analysis of the baccalaureate origins of Sloan fellows in the hard sciences across the Equality of Opportunity tiers of institutions.
The Sloan Fellowship is a prestigious award for early career scientists at U.S. and Canadian academic institutions. Each year 126 scientists are recognized. From the Sloan Fellowship website: “These 126 early-career scholars represent the most promising scientific researchers working today. Their achievements and potential place them among the next generation of scientific leaders in the U.S. and Canada.” Forty-three Sloan Fellows have gone on to win a Nobel Prize and 16 have won the Fields Medal in mathematics.
I looked up the CVs for all the Sloan Fellowship winners for all available years (2008-2016) in all fields: Math, Physics, Chemistry, Economics, Neuroscience, Computational Biology and Ocean Sciences. The names of the awardees are listed in the Sloan Foundation press releases. I noted the school where the awardee got their undergraduate degree. Here I analyze the patterns of the undergraduate institutions of those awardees who received their undergraduate degree in the United States (about 50% of awardees). I supplemented this data, with data on the undergraduate institutions from the Scorecard database on U.S. Baccalaureate institutions.
I will be showing a series of cumulative plots where I look at the Sloan production within groups of schools. I am not concerned with individual schools, but rather the production within a whole group of schools. Cumulative plots help one see patterns when one is looking at rare events, like Sloan fellows. Within a group, I sort by size of school (this is step is not important), and then take the cumulative sum of school size and number of Sloan fellows. I then plot cumulative sum of size (enrollment) against cumulative number of Sloan fellows.
For the first analysis, I used the tiers defined by the Equality of Opportunity Project (EOP) . These tiers include a relatively small set of schools (relative to all the private and public schools). I’m not sure how this set was defined, but certainly not using number of future Sloan Fellows. Notice the mean upper 75% ACT scores are similar across the groups within a tier (elite or highly selective). The EOP did not separate out the Liberal Arts colleges. I have to create separate tiers for these colleges. I did not use the EOP ‘highly selective public’ group since there are too many name differences between the EOP and Scorecard databases.
The Equality of Opportunity ‘Tiers’
EOP Ivy Plus group
Mean upper 75% ACT is 34.4615385.
##  [1] "brown university"
##  [2] "columbia university"
##  [3] "cornell university"
##  [4] "dartmouth college"
##  [5] "duke university"
##  [6] "harvard university"
##  [7] "princeton university"
##  [8] "stanford university"
##  [9] "university of chicago"
## [10] "university of pennsylvania"
## [11] "yale university"
## [12] "massachusetts institute of technology"
## [13] "california institute of technology"
EOP Elite Private group, no LACs
Mean upper 75% ACT is 33.1052632.
##  [1] "boston college"
##  [2] "brandeis university"
##  [3] "carnegie mellon university"
##  [4] "case western reserve university"
##  [5] "emory university"
##  [6] "georgetown university"
##  [7] "johns hopkins university"
##  [8] "lehigh university"
##  [9] "new york university"
## [10] "northeastern university"
## [11] "northwestern university"
## [12] "rice university"
## [13] "tufts university"
## [14] "tulane university"
## [15] "university of miami"
## [16] "university of notre dame"
## [17] "university of rochester"
## [18] "university of southern california"
## [19] "vanderbilt university"
## [20] "wake forest university"
## [21] "washington university in st louis"
EOP Elite Public group
Mean upper 75% ACT is 33.
## [1] "college of william and mary"
## [2] "university of california-berkeley"
## [3] "university of california-los angeles"
## [4] "university of michigan-ann arbor"
## [5] "university of north carolina at chapel hill"
## [6] "university of virginia-main campus"
EOP Elite group, only Liberal Arts colleges
Mean upper 75% ACT is 32.53125.
##  [1] "amherst college"               "barnard college"
##  [3] "bates college"                 "bowdoin college"
##  [5] "bryn mawr college"             "bucknell university"
##  [7] "carleton college"              "claremont mckenna college"
##  [9] "colby college"                 "colgate university"
## [11] "college of the holy cross"     "colorado college"
## [13] "davidson college"              "franklin and marshall college"
## [15] "grinnell college"              "hamilton college"
## [17] "haverford college"             "illinois wesleyan university"
## [19] "kenyon college"                "macalester college"
## [21] "middlebury college"            "oberlin college"
## [23] "pomona college"                "reed college"
## [25] "scripps college"               "swarthmore college"
## [27] "vassar college"                "washington and lee university"
## [29] "wellesley college"             "wesleyan university"
## [31] "whitman college"               "williams college"
EOP Highly Selective private, no LACs
Mean upper 75% ACT is 29.9130435.
##  [1] "american university"           "baylor university"
##  [3] "boston university"             "chapman university"
##  [5] "college of new jersey"         "elon university"
##  [7] "emerson college"               "fordham university"
##  [9] "george washington university"  "gonzaga university"
## [11] "loyola university chicago"     "loyola university maryland"
## [13] "loyola university new orleans" "marquette university"
## [15] "pepperdine university"         "providence college"
## [17] "quinnipiac university"         "santa clara university"
## [19] "southern methodist university" "syracuse university"
## [21] "texas christian university"    "university of richmond"
## [23] "university of san diego"       "university of tulsa"
## [25] "villanova university"
EOP Highly Selective private, LACs only
Mean upper 75% ACT is 30.35.
##  [1] "american university"           "baylor university"
##  [3] "boston university"             "chapman university"
##  [5] "college of new jersey"         "elon university"
##  [7] "emerson college"               "fordham university"
##  [9] "george washington university"  "gonzaga university"
## [11] "loyola university chicago"     "loyola university maryland"
## [13] "loyola university new orleans" "marquette university"
## [15] "pepperdine university"         "providence college"
## [17] "quinnipiac university"         "santa clara university"
## [19] "southern methodist university" "syracuse university"
## [21] "texas christian university"    "university of richmond"
## [23] "university of san diego"       "university of tulsa"
## [25] "villanova university"
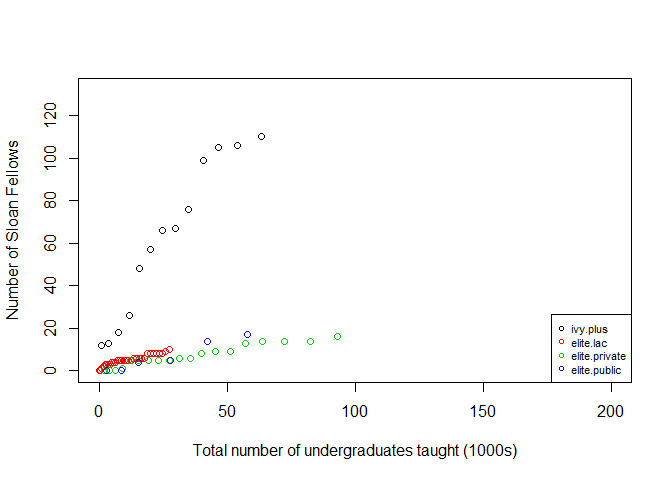
Sloan Fellows Produced in Math and Physics
This shows the cumulative number of Sloan fellows in each tier group. The x-axis is the cumulative total number of undergraduates in the tier group; I’ve ordered the institutions by size and then summed the sizes and number of Sloan fellows. Cumulative plots help one see patterns for rare events, and Sloan fellows are rare. If the line is higher it means the per capita production is higher in that tier group. The ‘Ivy Plus’ group greatly outproduced future Sloan Fellows in Math and Physics, however as you will see in the next blog post this is actually due to just four institutions: MIT, CalTech, Harvard and Princeton.
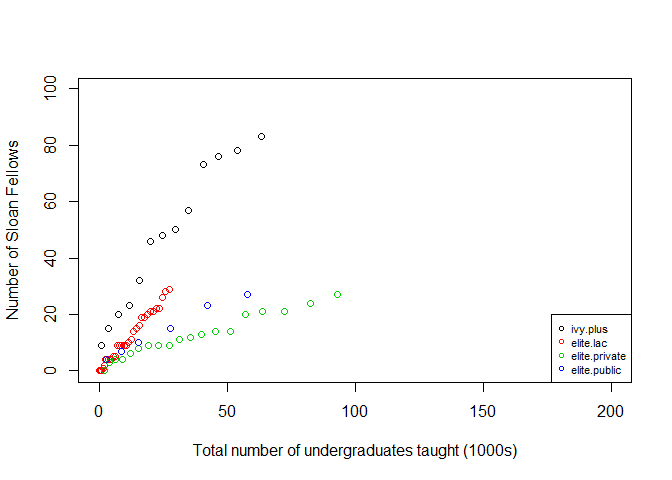
Sloan Fellows Produced in Neuroscience, Ocean Sciences, and Chemistry
Again the ‘Ivy Plus’ group outproduced Sloan Fellows. However, for these fields, the ‘Elite’ Liberal Arts colleges have a higher per capita (per undergraduate) production of future Sloan Fellows than the ‘Elite’ private and public schools.
Liberal Arts Schools
This uses the Equality of Opportunity Project ‘elite private’ and ‘highly selective private’ tiers, but only looks at the Liberal Arts colleges. Mean upper 75% ACT for the ‘elite’ Liberal Arts colleges is 32.53125 and the mean for the ‘highly selective’ schools is 30.35. The more selective LACs (elite) outproduce the less selective LACs.
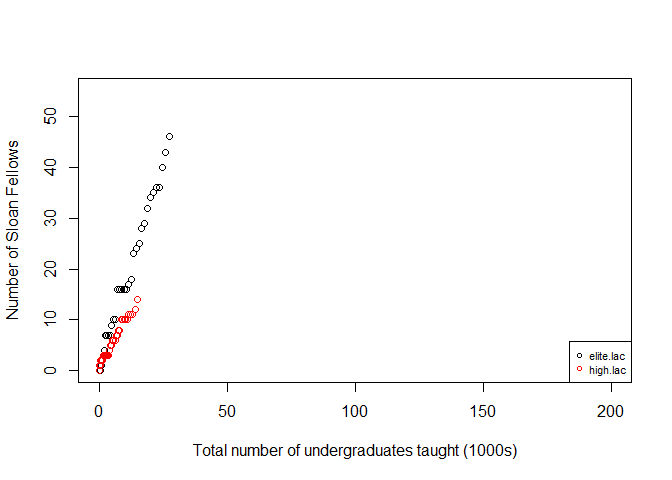
These patterns across the tier groups might simply represent the pool of undergraduates in the different tier groups and not represent any additional value added by the institutions.
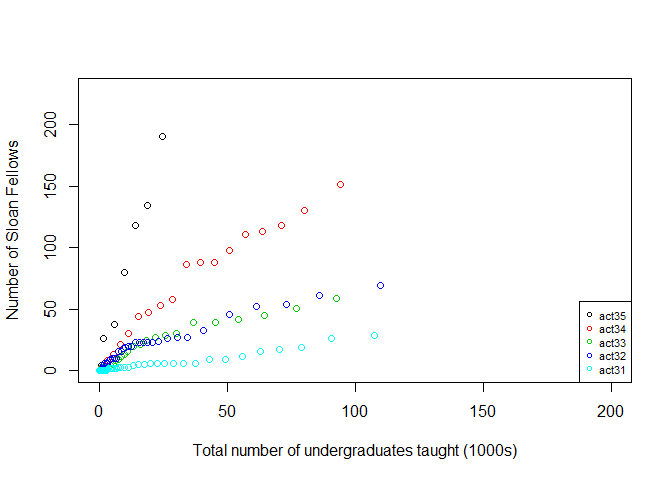
Sloan Fellows by ACT brackets
For this analysis, I ignore the EOP tiers and simply plot the cumulative sum of Sloan Fellows for schools with a upper 75% ACT score of 35, 34, …, or 31 (as reported in the Scorecard data). This plot shows that clearly the upper 75% ACT is a predictor for the number of future Sloan Fellows. I will need to correct for the differences in the selectivity of each school. If a school has more students with a very high ACT score, they would be expected to have more future Sloan fellows simply because they have a large ‘pool’.
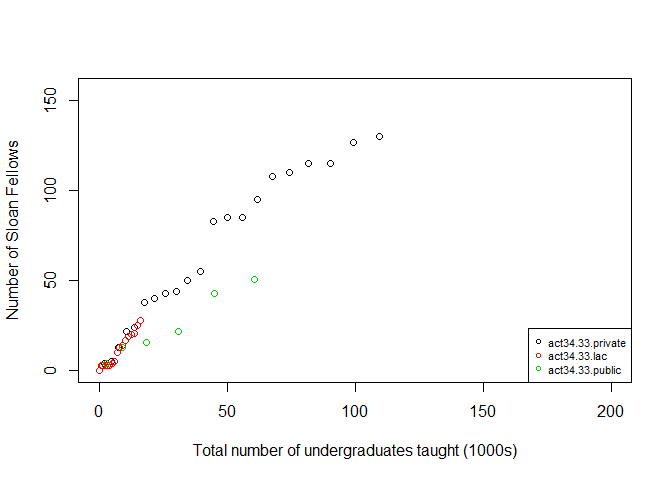
Sloan Fellows for schools with upper 75% ACT = 34 or 33 broken out by type of school
Before doing that (in the next post), I will do a preliminary analysis of the effect of ‘school type’. I abandon the Equality of Opportunity Project tier groups and I switch to defining the Carnegie School Classifications. I will use only resarch universities and baccalaureate colleges (liberal arts colleges). This information is part of the Scorecard data along with information on whether the institution is public or private.
- 15 = Doctoral Universities: Highest Research Activity
- 16 = Doctoral Universities: Higher Research Activity
- 18 = Master’s Colleges & Universities: Larger Programs
- 21 = Baccalaureate Colleges: Arts & Sciences Focus
The idea is to examine whether there is a difference in the production of future Sloan Fellows based on the type of institution (research university versus undergraduate institution).
For this analysis, I used all schools in the above categories with upper 75% ACT of 34 or 33. Scroll below the plot to see the schools in each group. I labelled schools as either LAC (baccalaureate), private (Carnegie Classification 15, 16 or 18 and private) or public (Carnegie Classification 15, 16 or 18 and public).
This plot shows that within this very high ACT group, LACs and private research universities have similar per capita Sloan production but public schools are lower even with the same upper 75% ACT scores.
act34.33.private
##  [1] "northwestern university"
##  [2] "university of notre dame"
##  [3] "johns hopkins university"
##  [4] "washington university in st louis"
##  [5] "dartmouth college"
##  [6] "columbia university"
##  [7] "cornell university"
##  [8] "duke university"
##  [9] "carnegie mellon university"
## [10] "university of pennsylvania"
## [11] "brown university"
## [12] "vanderbilt university"
## [13] "rice university"
## [14] "stanford university"
## [15] "university of southern california"
## [16] "georgetown university"
## [17] "boston college"
## [18] "brandeis university"
## [19] "northeastern university"
## [20] "tufts university"
## [21] "case western reserve university"
act34.33.public
## [1] "university of california-berkeley"
## [2] "university of california-los angeles"
## [3] "georgia institute of technology-main campus"
## [4] "university of michigan-ann arbor"
## [5] "college of william and mary"
## [6] "university of virginia-main campus"
act34.33.lac
##  [1] "pomona college"                "amherst college"
##  [3] "williams college"              "haverford college"
##  [5] "swarthmore college"            "claremont mckenna college"
##  [7] "scripps college"               "wesleyan university"
##  [9] "grinnell college"              "bowdoin college"
## [11] "wellesley college"             "carleton college"
## [13] "hamilton college"              "vassar college"
## [15] "reed college"                  "middlebury college"
## [17] "washington and lee university"
Next Analysis
For the next analyses, I control for the (estimated) number of undergraduates with high math SAT scores at each institution. Math SAT scores are not a perfect metric of future STEM productivity, but are highly correlated with required career prerequisites for a Sloan fellowship, namely a PhD in a STEM field.
Raw Data
Math and Physics Data
EOP Ivy Plus group
| School | Fellows | Size |
|---|---|---|
| brown university | 5 | 6264 |
| california institute of technology | 12 | 983 |
| columbia university | 6 | 8100 |
| cornell university | 4 | 14195 |
| dartmouth college | 1 | 4184 |
| duke university | 1 | 6480 |
| harvard university | 23 | 7236 |
| massachusetts institute of technology | 9 | 4476 |
| princeton university | 22 | 5258 |
| stanford university | 9 | 7018 |
| university of chicago | 9 | 5729 |
| university of pennsylvania | 1 | 10678 |
| yale university | 8 | 5473 |
EOP Elite private group, no LACs
| School | Fellows | Size |
|---|---|---|
| boston college | 0 | 9483 |
| brandeis university | 0 | 3715 |
| carnegie mellon university | 2 | 5819 |
| case western reserve university | 1 | 4807 |
| emory university | 0 | 7730 |
| georgetown university | 0 | 7211 |
| johns hopkins university | 1 | 6039 |
| lehigh university | 0 | 5034 |
| new york university | 2 | 24539 |
| northeastern university | 0 | 13492 |
| northwestern university | 1 | 8725 |
| rice university | 4 | 3888 |
| tufts university | 0 | 5143 |
| tulane university | 0 | 7892 |
| university of miami | 0 | 10828 |
| university of notre dame | 1 | 8427 |
| university of rochester | 0 | 6074 |
| university of southern california | 0 | 18392 |
| vanderbilt university | 0 | 6818 |
| wake forest university | 0 | 4861 |
| washington university in st louis | 4 | 6913 |
EOP Elite private group, only LACs
| School | Fellows | Size |
|---|---|---|
| amherst college | 0 | 1792 |
| barnard college | 0 | 2556 |
| bates college | 1 | 1773 |
| bowdoin college | 0 | 1797 |
| bryn mawr college | 0 | 1303 |
| bucknell university | 0 | 3528 |
| carleton college | 2 | 2042 |
| claremont mckenna college | 0 | 1293 |
| colby college | 0 | 1847 |
| colgate university | 1 | 2865 |
| college of the holy cross | 0 | 2754 |
| colorado college | 1 | 2036 |
| davidson college | 0 | 1765 |
| franklin and marshall college | 0 | 2182 |
| grinnell college | 0 | 1670 |
| hamilton college | 0 | 1890 |
| haverford college | 0 | 1187 |
| illinois wesleyan university | 0 | 1883 |
| kenyon college | 0 | 1651 |
| macalester college | 1 | 2053 |
| middlebury college | 0 | 2498 |
| oberlin college | 0 | 2961 |
| pomona college | 0 | 1635 |
| reed college | 1 | 1335 |
| scripps college | 0 | 962 |
| swarthmore college | 1 | 1530 |
| vassar college | 0 | 2389 |
| washington and lee university | 0 | 1880 |
| wellesley college | 0 | 2172 |
| wesleyan university | 1 | 2907 |
| whitman college | 1 | 1480 |
| williams college | 0 | 2019 |
EOP Elite public group
| School | Fellows | Size |
|---|---|---|
| college of william and mary | 0 | 6256 |
| university of california-berkeley | 9 | 27126 |
| university of california-los angeles | 1 | 29627 |
| university of michigan-ann arbor | 3 | 28217 |
| university of north carolina at chapel hill | 0 | 17908 |
| university of virginia-main campus | 4 | 15515 |
Neuroscience, Chemistry and Ocean Sciences Data
Ivy Plus
| School | Fellows | Size |
|---|---|---|
| brown university | 5 | 6264 |
| california institute of technology | 9 | 983 |
| columbia university | 3 | 8100 |
| cornell university | 5 | 14195 |
| dartmouth college | 6 | 4184 |
| duke university | 2 | 6480 |
| harvard university | 16 | 7236 |
| massachusetts institute of technology | 14 | 4476 |
| princeton university | 9 | 5258 |
| stanford university | 7 | 7018 |
| university of chicago | 2 | 5729 |
| university of pennsylvania | 2 | 10678 |
| yale university | 3 | 5473 |
Elite private
| School | Fellows | Size |
|---|---|---|
| boston college | 1 | 9483 |
| brandeis university | 3 | 3715 |
| carnegie mellon university | 1 | 5819 |
| case western reserve university | 0 | 4807 |
| emory university | 1 | 7730 |
| georgetown university | 0 | 7211 |
| johns hopkins university | 2 | 6039 |
| lehigh university | 1 | 5034 |
| new york university | 3 | 24539 |
| northeastern university | 0 | 13492 |
| northwestern university | 1 | 8725 |
| rice university | 2 | 3888 |
| tufts university | 2 | 5143 |
| tulane university | 0 | 7892 |
| university of miami | 0 | 10828 |
| university of notre dame | 1 | 8427 |
| university of rochester | 3 | 6074 |
| university of southern california | 3 | 18392 |
| vanderbilt university | 0 | 6818 |
| wake forest university | 0 | 4861 |
| washington university in st louis | 6 | 6913 |
Elite private LAC
| School | Fellows | Size |
|---|---|---|
| amherst college | 0 | 1792 |
| barnard college | 0 | 2556 |
| bates college | 1 | 1773 |
| bowdoin college | 1 | 1797 |
| bryn mawr college | 1 | 1303 |
| bucknell university | 0 | 3528 |
| carleton college | 1 | 2042 |
| claremont mckenna college | 0 | 1293 |
| colby college | 1 | 1847 |
| colgate university | 1 | 2865 |
| college of the holy cross | 0 | 2754 |
| colorado college | 0 | 2036 |
| davidson college | 0 | 1765 |
| franklin and marshall college | 0 | 2182 |
| grinnell college | 0 | 1670 |
| hamilton college | 1 | 1890 |
| haverford college | 0 | 1187 |
| illinois wesleyan university | 1 | 1883 |
| kenyon college | 0 | 1651 |
| macalester college | 4 | 2053 |
| middlebury college | 3 | 2498 |
| oberlin college | 1 | 2961 |
| pomona college | 1 | 1635 |
| reed college | 2 | 1335 |
| scripps college | 0 | 962 |
| swarthmore college | 3 | 1530 |
| vassar college | 0 | 2389 |
| washington and lee university | 0 | 1880 |
| wellesley college | 1 | 2172 |
| wesleyan university | 2 | 2907 |
| whitman college | 0 | 1480 |
| williams college | 4 | 2019 |
EOP Elite public group
| School | Fellows | Size |
|---|---|---|
| college of william and mary | 4 | 6256 |
| university of california-berkeley | 8 | 27126 |
| university of california-los angeles | 5 | 29627 |
| university of michigan-ann arbor | 4 | 28217 |
| university of north carolina at chapel hill | 3 | 17908 |
| university of virginia-main campus | 3 | 15515 |