Remote-sensing plots
I have been working the last 5 years on a project having to do with the upwelling zones off the coast of India. As part of this, I have been working on ways to visualize the upwelling zone—a spatial and temporal visualization problem. I have some RMarkdown files showing how to create these in R using data from the NOAA ERDDAP data server.
Gifs and movies
The first example I have is how to make a movie (or gif) from remote-sensing data.
I have two vignettes that show how to do this:
- Gifs of SST off the SW Coast of India 2015-2017
- Movie from Gifs of SST off the SW Coast of India 2015-2017
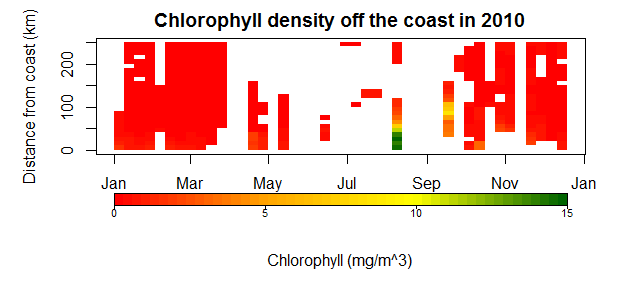
Colorbar plot
The second example is how to make a colorbar over time and space. Here is an example of chlorophyll off the coast of India in 2010. It is not very interesting since there are many NAs, but you get the idea.