Plots
Functions
plot2()a basic plot of total, hospitalized, and deaths. First argument is a data object (states, italy, world or subset of these) and second argument is a region (can be partial). Use ?plot2 to read the help page.
Example of Making Plots
library(CoV19)
plot2(italy, "Lomb", decorate=TRUE)
plot2(states, c("WA","CA"))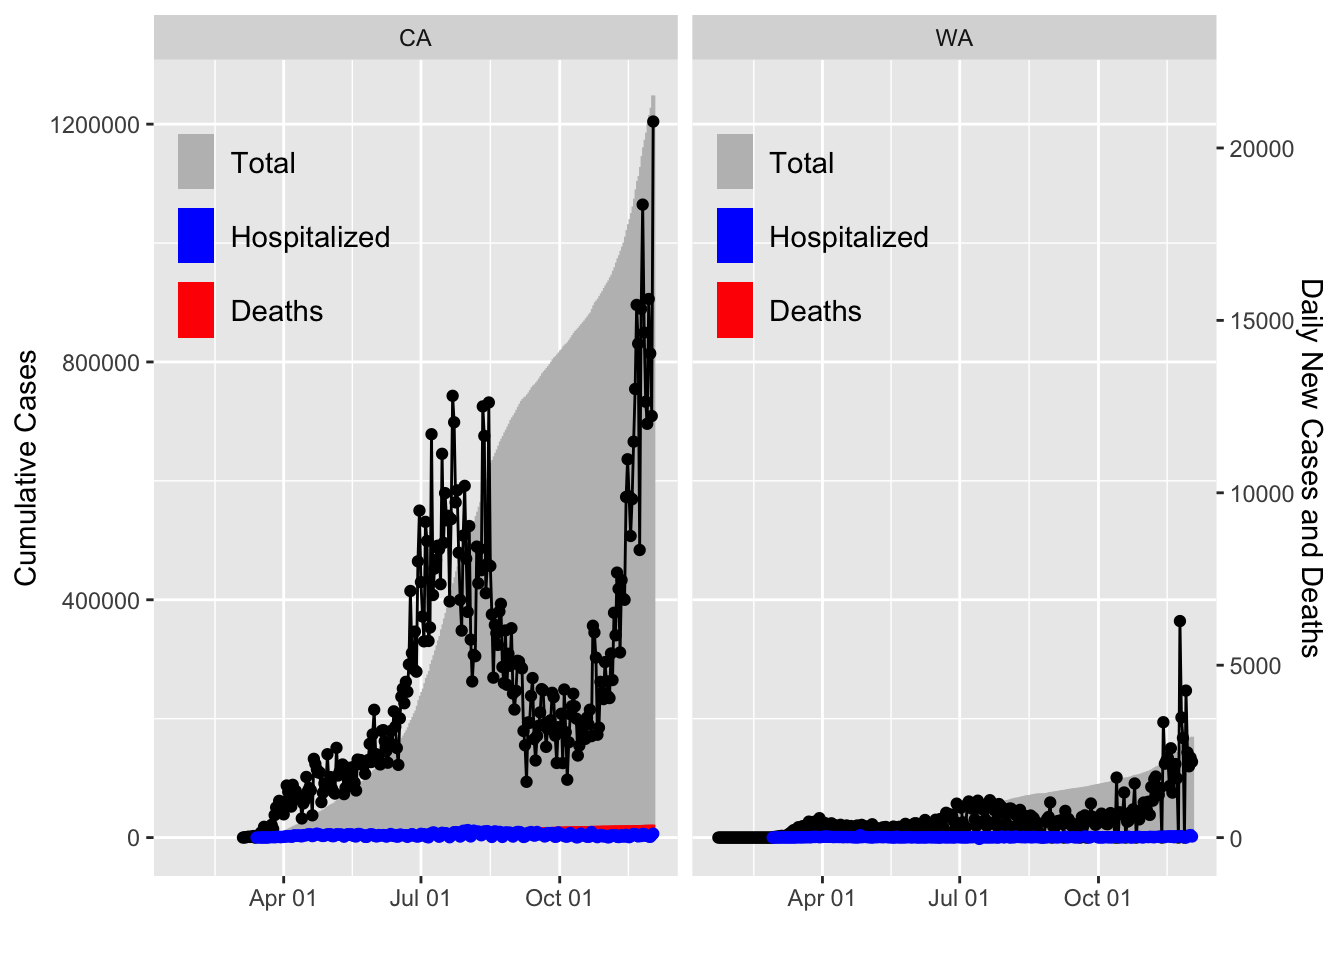
plot2(states, c("NY","NJ","PA","MA"))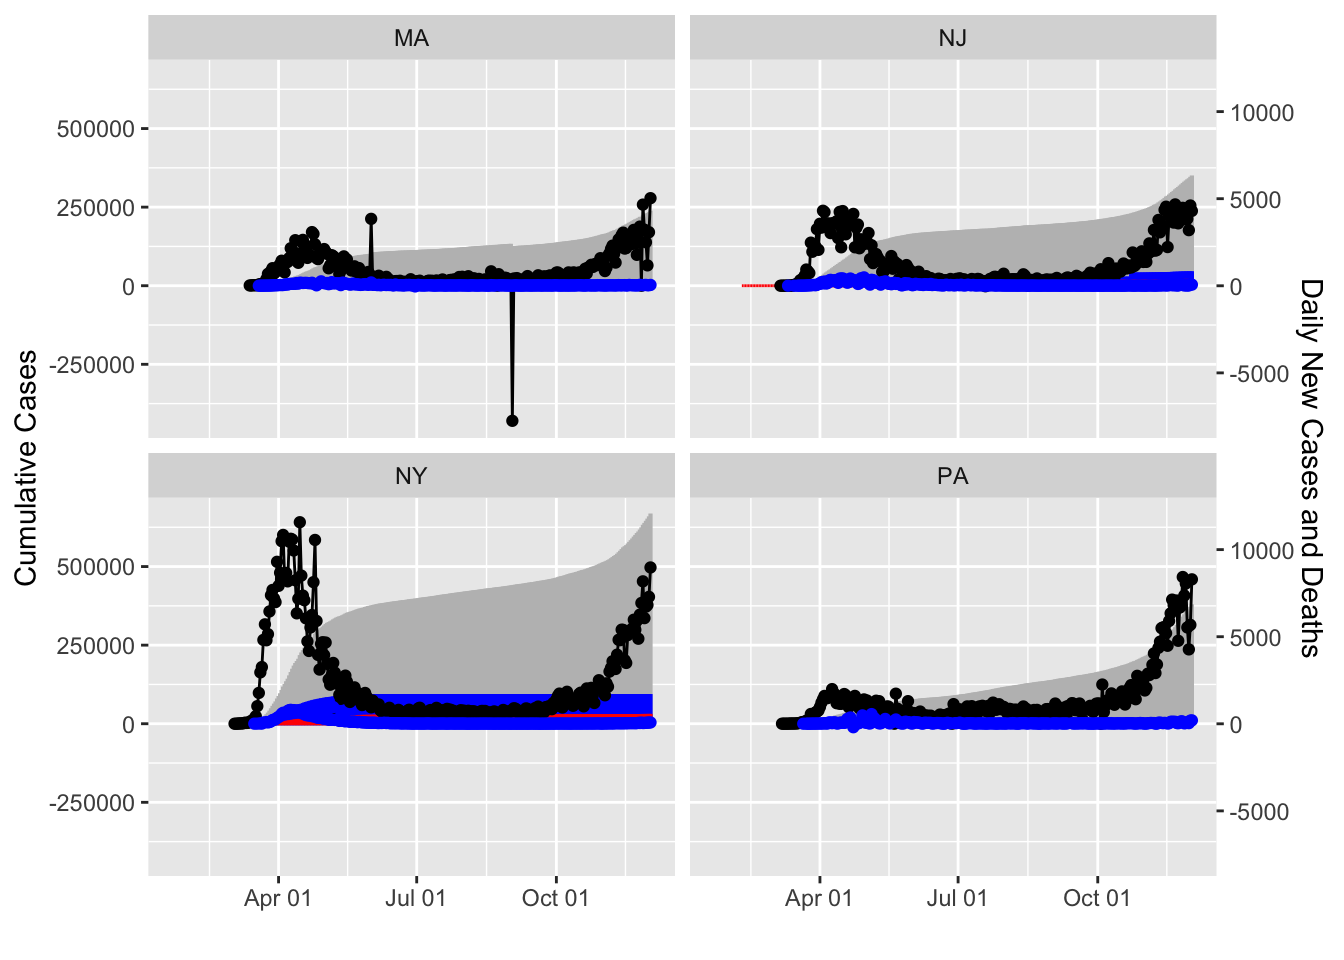
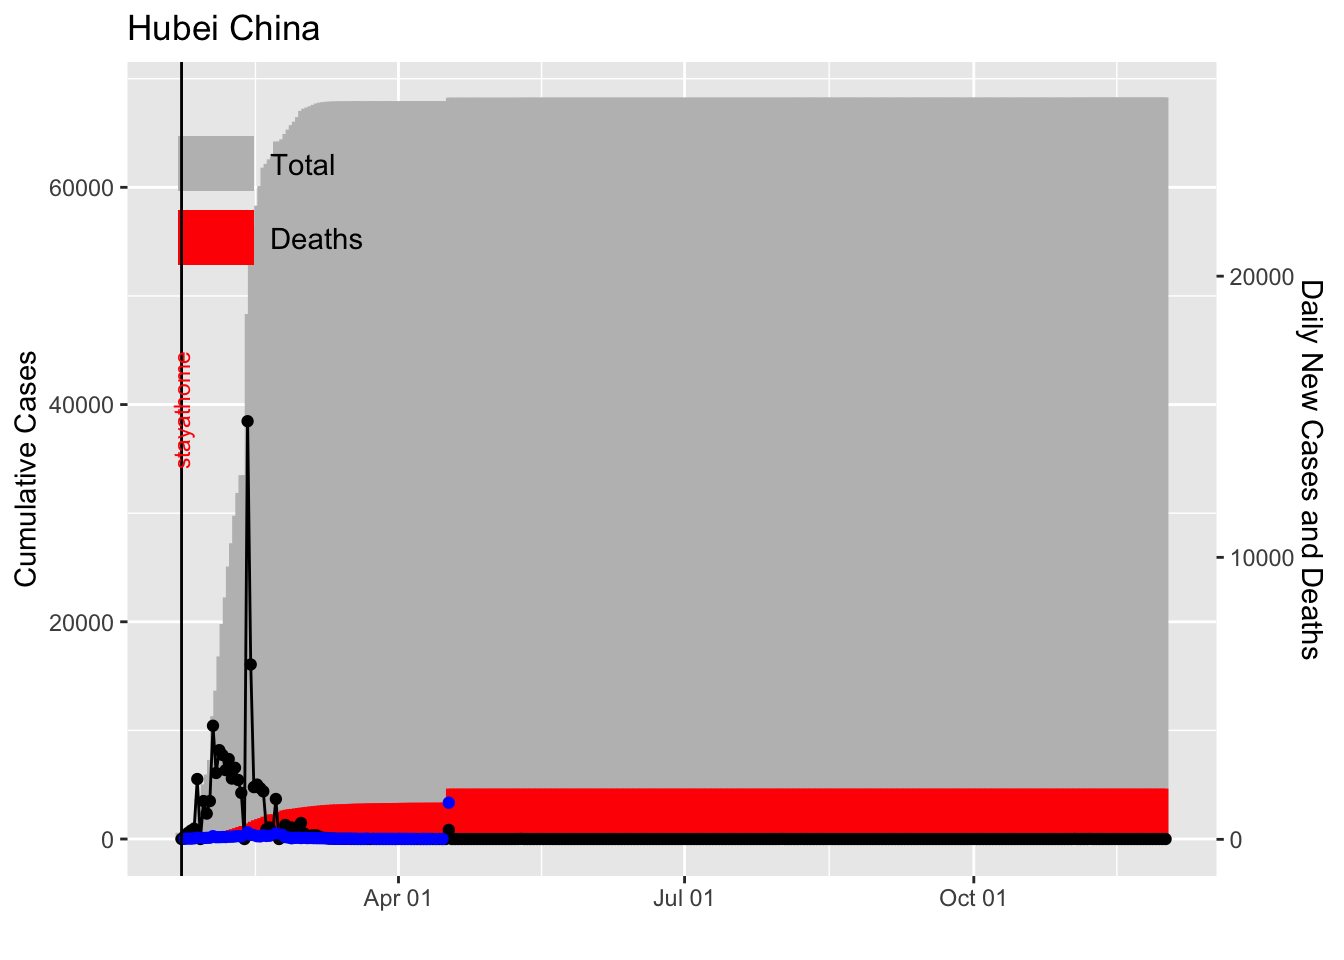
Something is odd with the Hubei data in the JHU data set.
plot2(world, "Hubei China", decorate=TRUE)